Last Sunday, 3 May, was our ‘Country Overshoot Day’ in the Netherlands. It’s the day of the year when our collective Dutch footprint exceeds the biocapacity required to meet our needs. But now that the global economy has been brought to a standstill by the Coronavirus, a question arises: what does this do to the already calculated ‘Country Overshoot Days’?
Every year I eagerly look forward to the Global Footprint Network’s calculations, revealing when ‘Earth Overshoot Day’ is, as well as when we reach our ‘Country Overshoot Day’ in the Netherlands.
Why?
I think these Overshoot Day calculations are a very effective way of communicating how oversized our footprint is in the Western world. After all, there are countries where the situation is reversed – where biocapacity exceeds the footprint. These countries have a so-called ecological ‘reserve’ (which is shown in green on the map below). To be clear, as this map also shows, the Netherlands is deep in the red.
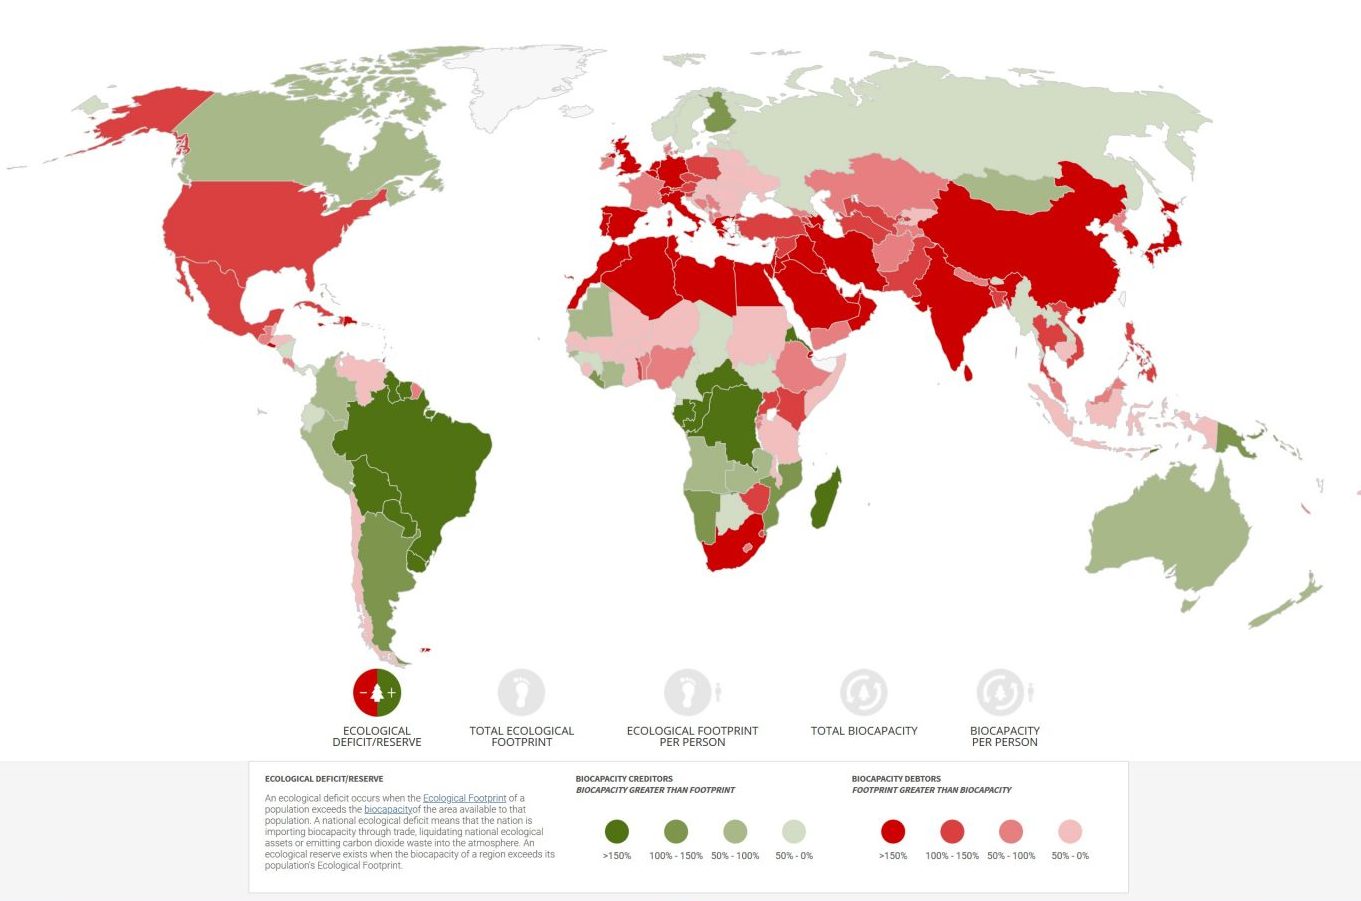
Biocapaciteit per land, bron: Global Footprint Network 2020
The question of what the global pandemic will do to these calculations is also one the Global Footprint Network itself is concerned with. The assumption is that the Coronavirus has reduced our global footprint.
In order to analyze the effect this could have on the Dutch Overshoot Day, it is important to delve into the methodology and to look for data points that have shown a deviation in trend since the Coronavirus pandemic began.
First let’s look at the methodology, which consists of two meta-indicators:
- The biocapacity of a country. The biocapacity is calculated as the sum of the biologically productive land that is available to meet a population’s needs and to absorb its ‘waste’ (for example, CO2 emissions). This figure reflects the specific productivity of a country’s ecosystems. Biocapacity is expressed in ‘global hectares’ or Gha.
- The footprint of a country. For the footprint, we look at how much biologically productive land is required to meet a population’s needs. This includes the space needed for food production, construction, forest restoration and the absorption of CO2 A country’s total consumption is calculated by adding to these figures the import of products and subtracting exports. The idea behind this is that all products and commodities are accompanied by an ecological footprint.
Second is the question of how these meta-indicators change as a result of the Corona crisis. A disclaimer is needed here: our research confirms that it is extremely difficult to find current data on some of the relevant factors, such as consumption, import and export. Many global databases can take two to three months to come up with current figures, and – ‘luckily’ – we have only been in this situation for two months. Nevertheless, we consulted several reliable sources in order to paint a picture of the Corona Country Overshoot Day for the Netherlands.
Our biocapacity is likely to remain the same. According to the Global Footprint Network’s calculations, in 2020 biocapacity will amount to 0.8 Gha per person for the Netherlands.
To calculate the footprint, we need to look at the ecological footprint that goes along with our consumption. This was originally calculated to be 4.8 Gha.
Although it is challenging to find out recent consumption figures, data on consumer confidence from Statistics Netherlands (Centraal Bureau voor de Statistiek, CBS) provides a realistic picture of how our average consumption will change. In April, CBS reported the ‘biggest ever drop in consumer confidence’, falling to -22! ING’s figures(in Dutch) for the number of debit card transactions tell the same story: up to 27 April, the total number of transactions had decreased by 22% and turnover by more than 18%. As lockdown measures become more flexible, a slight increase is expected, but this has already had an effect on our national footprint.
To calculate the footprint, it seems generally wise to search a level deeper for relevant developments. The Global Footprint Network calculates the ecological footprint of consumption as follows:
Ecological footprint of production + Net ecological footprint of international trade
To investigate this, I dive into three sub-indicators:
- First up are the production figures for the Netherlands. We are already familiar with the concept of consumer confidence; there is also something known as producer confidence. At the end of April, the CBS reported that confidence among industrial entrepreneurs is at the lowest level (-28.7) since measurements began in 1987. There might not be any current production figures, but the capacity utilization rate of machines reflects the trend in production – and it is now over 8.5% lower than it was in the first quarter of the year. Production is expected to have suffered as a result of Coronavirus, and that this will lead to a lower ecological footprint than was originally calculated.
- Then we dive into the import figures for the Netherlands – the products we import have an ecological impact that can be attributed to this country. Although import figures are only available for the first quarter of 2020, they already show a decrease in total goods imports of over 3%. In the first quarter, imports of goods from China fell by at least 9%, which is significant, given that China is one of the country’s top three trade partners. Almost all products showed a decrease in imports, with the exception of solar panels – there was an increase compared to 2019! Less imports means a lower ecological footprint.
- Finally, we look at export figures – an important indicator, because the Netherlands is a net exporter. Despite being a small country, we are 6th on the list of worldwide exporters (in Dutch). The export of products is removed from our ecological footprint and added to the footprints of the countries that import ‘our’ products. Recent national export statistics are hard to find, but a more thorough analysis leads to the assumption that exports have suffered. To be somewhat conservative in the analysis, I focus on export products that can’t be balanced by reduced production – agriculture. While we exported more than €94.5 billion worth of agricultural products in 2019 (accounting for almost 20% of our national exports in turnover), we can say with reasonable certainty that these figures will not be achieved in 2020. An illustration of this is floriculture: as a large earner for the Netherlands, floriculture accounted for more than €5.8 billion in turnover; a decrease of more than 70% (in Dutch) is expected for the second quarter of this year. The difficult thing is that whatever has already been produced, in agriculture and horticulture, for example, already has an ecological footprint, and until it is exported, that cannot be transferred to other countries.
So a deeper look into the figures for the footprint leads us to a more positive picture of a number of indicators; after all, our consumption, production, and imports are decreasing. At the same time, reduced exports, particularly those that can’t be ‘balanced’ due to reduced production (for example, in agriculture), have a negative impact on our total footprint.
The Global Footprint Network shows that the footprint is a reflection of GDP. At the end of March, the CPB released four scenarios for GDP, in which GDP contracts between 1.2% and 7.7%. If we take the CBP’s fairly optimistic second scenario, which predicts that GDP will contract by 5% in 2020, the Corona Country Overshoot Day ends up being 15 May 2020.
The current economic shrinkage has led to a ‘better’ Country Overshoot Day, but I find the difference relatively limited. Despite the brake being put on the economy, we are not yet making big strides forward. And, perhaps more importantly, the economic shrinkage is anything but a conscious choice. If we want to structurally commit to an economy in which we remain within our planetary limits, we must also dare to look at the structures that sustain growth, production and consumption. Because I’m not satisfied with just ‘accidentally’ doing a little better.